Start off by going to the campaign view:
![]()

Then choose the campaign you wish to see the stats for:

Which will then open the statistics which is described below:

Here you have the main statistics for the sent campaign. At the top left you have the status of the campaign, its activation date and the tracking period for its Sales, and at the bottom, going from left to right
| KPI | Description |
|---|---|
| Audience | The total number of recipients in the campaign. |
| Delivered | Total amount of emails, sms or push messages delivered based on campaign type. |
| Opens | How many of recipients opened the campaign. To track opens, Custobar relies on loading the images inside the content. Because of how certain email clients handle loading those images, this may return some "clicks" in rare instances. |
| Clicks | How many recipients interacted with the campaign, e.g. by clicking an item on the message. Please note that this is a count of Unique clicks. This means machine clicks and false-positives from loading images will not have a big impact on this metric. |
| Unsubscribes | How many recipients unsubscribed through this campaign. |
| Bounces | Amount of blocked messages that did not reach the recipient in this sending. This value includes errors such as the mailbox of the recipient is full or the email address is not recognized by the receiving mail service. |
| Conversion | Conversion-% of this campaign, for a sale to be counted into the conversion it requires that the customer reacts to the email first. Either by opening it or clicking on it and then making his or her purchase within the desired sales tracking period. (The tracking period is set when the campaign is activated, check our campaign tutorial video for more information) |
Please note: The audience will be adjusted at the time of sending to filter out invalid or blocked email addresses, this means the actual audience at the time of sending might be slightly smaller than the segment defined in the customer search section. The Open, Click, Unsubscribe, Bounce and Conversion rates are all calculated based on the Delivered count, not the Audience.
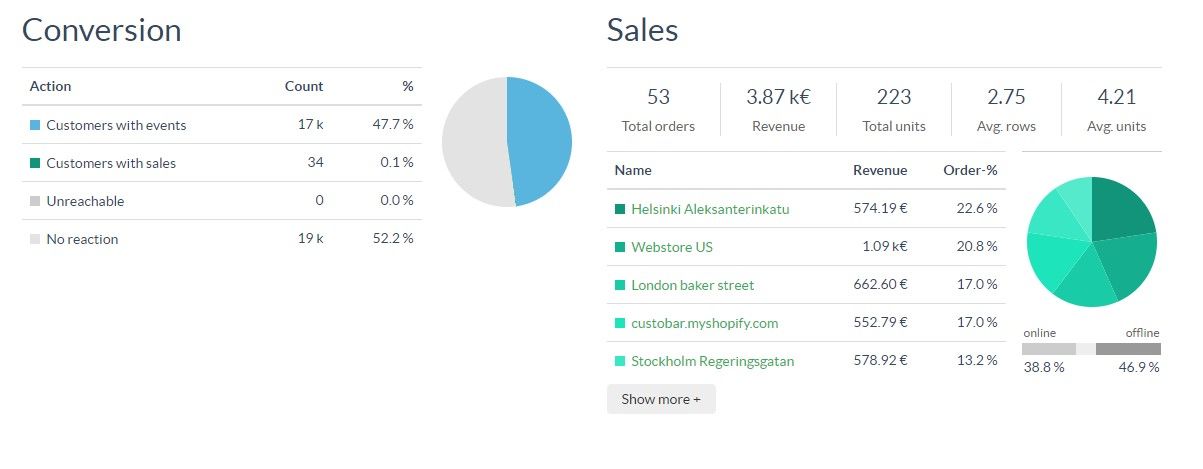
When you scroll down you get more insight on for example:
-
Which store was the one that brought in the most sales
-
The total revenue for the campaign
-
How big % of the sales came from online sales and offline sales

Further down the page you will have even more insight on the statistics such as:
- Click map for the clicks on the different links and buttons in the campaign. You can see an overview of the click counts per url. Those will be all click Events we received from the email dispatcher, so the count might include machine clicks, false-positives from loading images, more than one click per url if the recipient clicked the link more than once, etc. As such, it is not abnormal to see more clicks than for the unique click count above which is capped at counting "one click per recipient".

By clicking the detailed view in the top right corner you can see the breakdown in the campaign content directly. You can further filter the detailed click statistics by device types such as Desktop, Mobile or Tablets.

- Products that were sold through the campaign. If a product was featured in the content of the campaign using a product module and the drag-and-drop logic, it will be listed under "Campaign products" all other products bought will be listed under "Other products". If product recommendations add-on is enabled, a third category "Recommended products" will be included.

The "Campaign products" will never include recommended products as they are the dragged-and-dropped regular products in your campaign, those you manually picked and featured. The "Recommended products" are products that were shown through the product recommendations feature and were purchased by the recipient who saw them in their personalized content. The "Other products" are any other product sold during the tracking period by a recipient who took part in the campaign.
