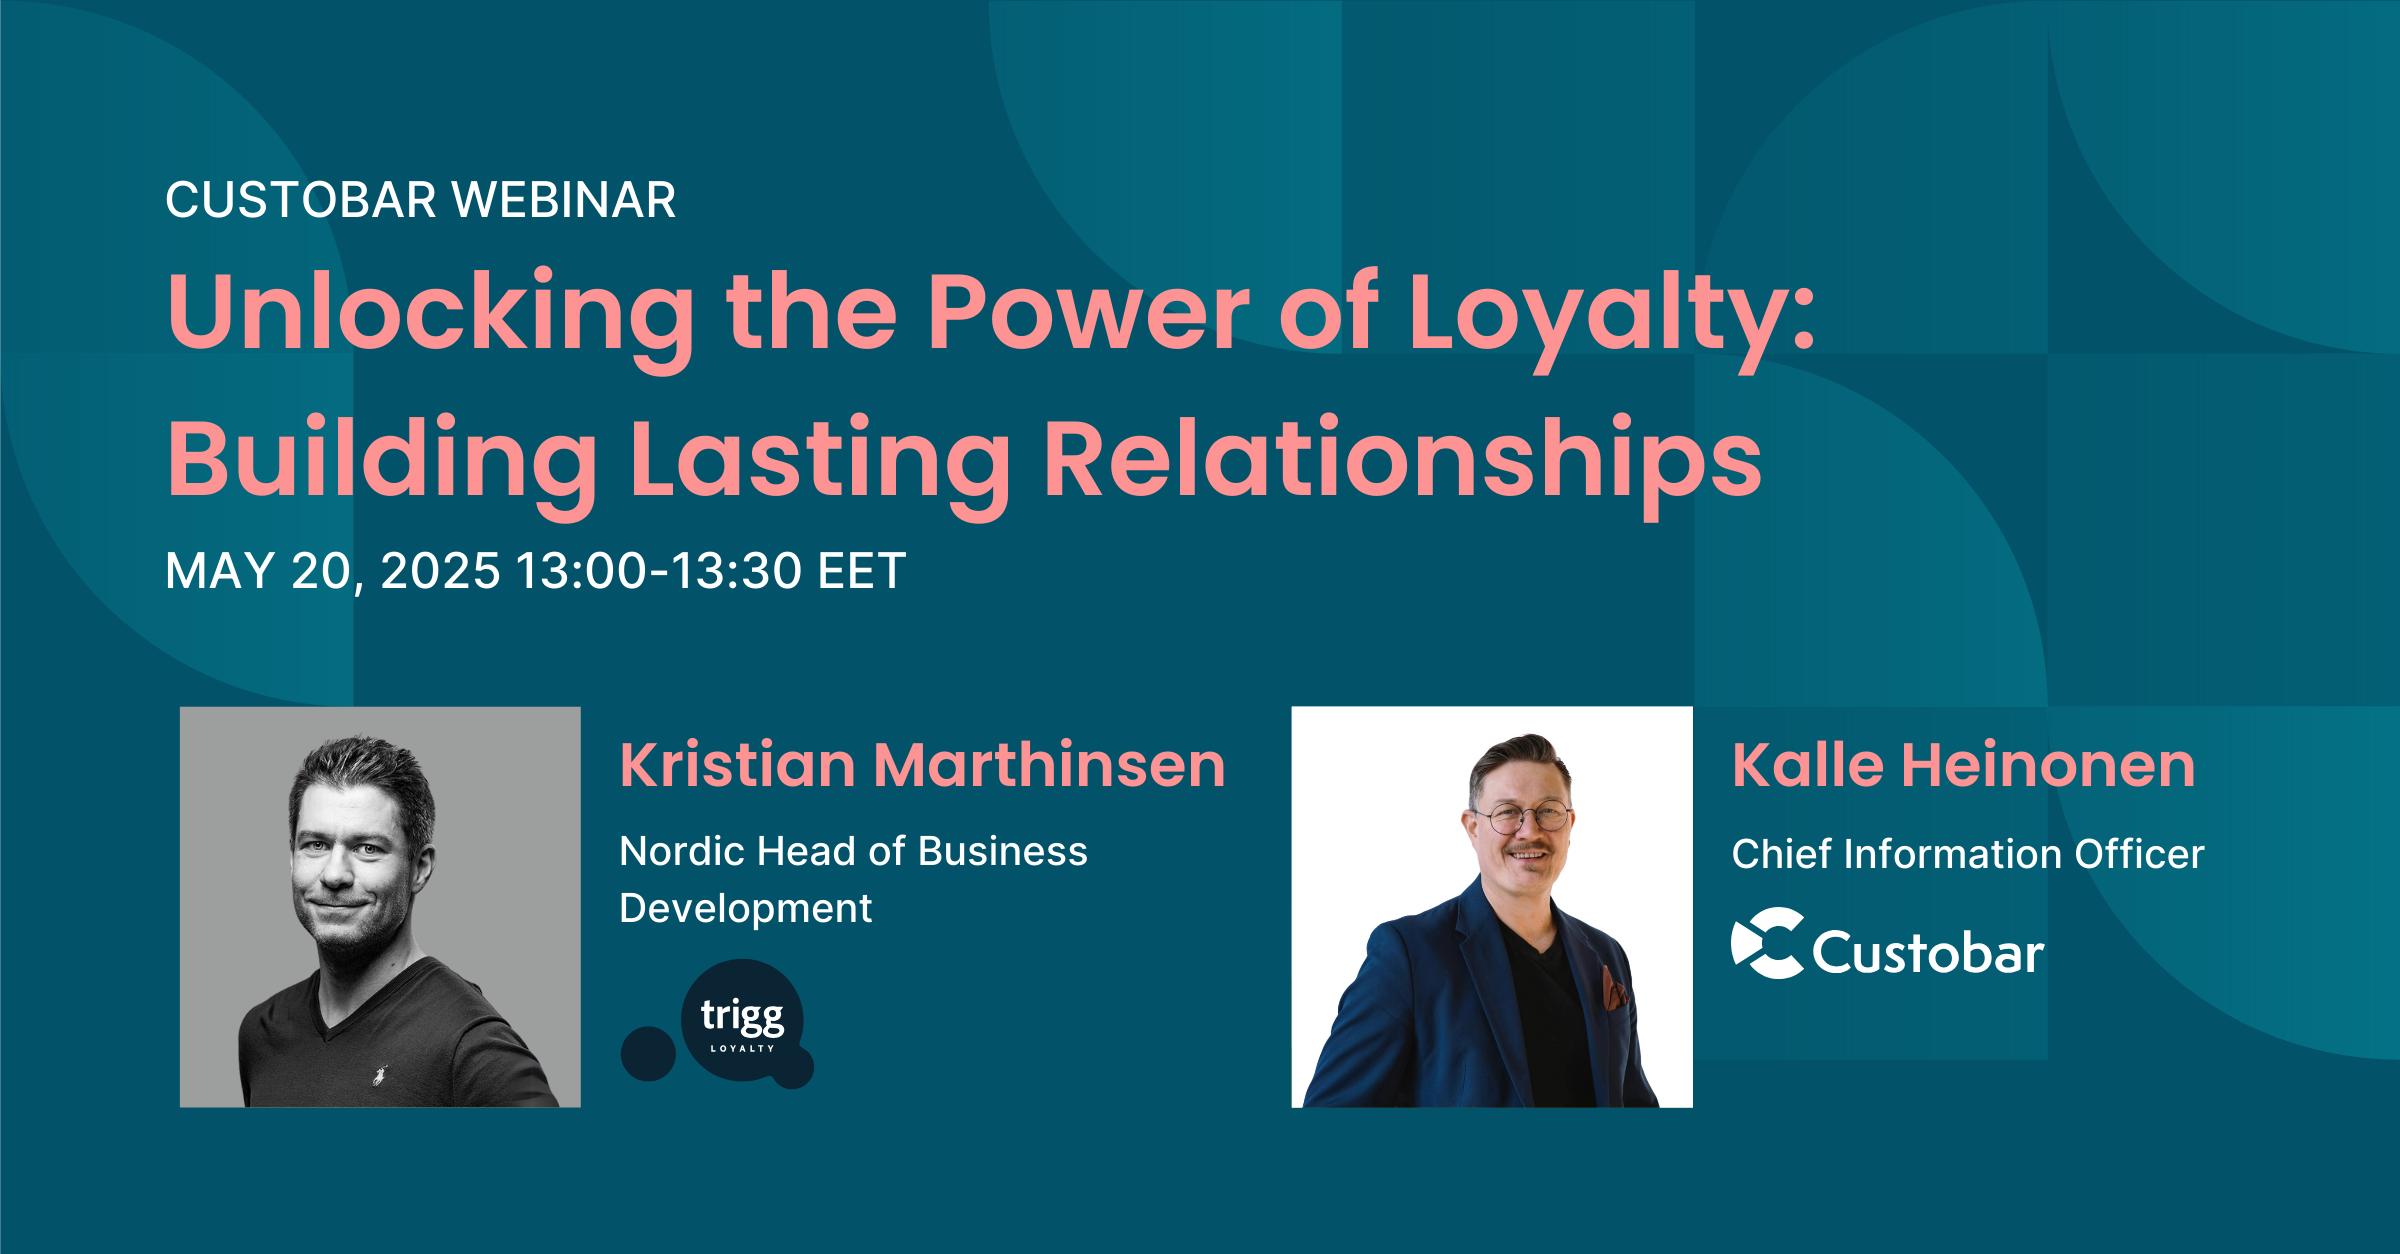
Blog

Combining customer data and BI reporting tool for enriched marketing data reports

Combining customer data and BI reporting tool for enriched marketing data reports

Marketing tools come with ready-made marketing data reports that typically cover most sales, customer service and marketing needs. However, when you want to combine marketing data with other business data or you need specialised domain-specific reports, you can enrich your reports by using a data integration service.

In this post, we will take a look on how you can combine business data from all sources and create tailored reports for specific needs.

Start by combining your customer data

The first step towards better reporting is getting your customer data in order. While many companies have a ton of customer data, the data is scattered around the company functions.

Marketing, sales and customer service all work with the same customers but fail to combine all customer information into a single view.

Customer data platforms like Custobar are designed to turn this problem into an opportunity. A customer data platform combines all customer data, such as personal and demographic data, purchase data, behavioural data and qualitative data on customer preferences from all touchpoints.

So, a CDP brings all the customer data together and helps you personalise your content and build automations for timely and relevant customer communications and marketing. Direct business benefits include higher conversion rates, additional sales and making your marketing channels more effective.

Advanced reporting with data integration service and data warehouse

Once you have your customer data in check, you can start combining customer and other business data with a data integration service like QuickBI. With integrations, a data warehouse, and a BI tool, you can go beyond the standard reporting options provided by your marketing tools.

By bringing data from different sources to your data warehouse, you get more options for both reporting and reviewing your data. Also, being able to access all your data in one place, makes reporting faster, more agile and transparent.

Arranging and combining data in various ways in your reports will help you to figure out trends, patterns, and other relations, and this way to gain deeper insight for making decisions and taking actions to develop and grow your business.

As a practical example, let’s say that you operate a national chain of dental clinics, and you want to find out the most cost-efficient channel (text messages, email or phone calls) to bring back existing customers. With advanced reporting, you can combine the conversion rates from different channels with actual channel-specific costs to find out the best alternative.

Another example: if you want to understand the differences between individual dental clinics in your national chain, you could combine data from various sources to compare the clinics. You could create custom reports to compare customer satisfaction, customer volumes, revenue, location and even payment methods.

What’s important to understand is that you have a wealth of data from different sources – combining the data and creating easy-to-ready reports might uncover insights that really boost your business.

Build tailored reports for specific needs

One of the key benefits of using an integration service and a data warehouse is the possibility to build custom reports that combine data from any data sources. Companies might have very specific reporting needs due to their business domain, market situation or partnerships, for example. Tailored reports allow you to visualise the exact metrics that are essential for your daily operations.

What’s more, your BI tool can also provide additional options to visualise your reports. It can offer a wealth of visualisation options from various charts, diagrams, and trend maps.

{{}}BI tool visualisation examples{{}}

With custom reporting, it is sometimes difficult to know exactly which data points you should combine and how to build an effective report out of them. Here’s where consulting services come into play.

For example, QuickBI provides consulting services that help you get the most out of your data and your BI tools. Getting started with advanced reporting is as easy as describing your problem or what you want to achieve – experienced consultants can then figure out the solution and set up the reporting in the BI tool.

Let your data flow through integrations

When you are looking for stable, continuous reporting based on data from multiple sources, data integrations become essential. Integrating your customer data platform to your BI reporting tool through a data warehouse ensures timely reporting based on fresh, reliable data.

As the data warehouse acts as the central hub for all your business data, the solution should have a large variety of built-in integration options as well as the possibility to build new integrations easily.

See QuickBI’s ready made integrations and check if your systems are already on the list or contact QuickBI to request new integrations.